How To Read Windows Dump DMP Files In Windows 10 After A Crash?
437 Views
A Windows 10 PC may crash if there is not enough memory or hard disk space. Windows 10 stores a dump of the memory state and system state information in the DMP files. You can read those DMP files in Windows 10 in case of a system crash after you know how to read them. Here I will guide you how to open, view, diagnose and read DMP files in Windows 10.
Have you experienced your computer crashing? Have you ever seen the so-called “blue screen of death”? Such a situation can be very problematic, but in case you are able to boot up Windows again, it will start the troubleshooting procedure to try to fix the issue.

After troubleshooting, Windows will create a dump file containing all the information about the crash in a compressed form. It is not a .txt or .doc file, so opening and reading it will take a few processes.
What Does the Dump File Contain?
The dump file contains information about any technical problem experienced by Windows. The more frequent the problem, the more files will be created. Moreover, the more severe the problem was, the larger the file will be created.
Here is the following information that the dump file contains:
- List of drivers
- ‘Stop’ message and its parameters
- ‘PRCB’ for the stopped processor
- ‘EPROCESS’ for the stopped process
- ‘ETHREAD’ for the stopped thread
- ‘Kernel-mode call stack’ for the stopped thread
The minimum size of a dump file is 2 megabytes. All dump files that Windows generated will be stored in the %SystemRoot%Minidump folder in your C drive. In order to conserve space, you need to adjust the settings and make the dump files small wherein only the most important information is generated.
How to Read Dump Files?
Before reading the dump files, you first have to configure the size so that in an event of a crash, Windows will create small dump files instead during troubleshooting. Afterward, you will need the help of a program called WinDbg Preview to help extract the readable information from dump files. The program is free and downloadable from Microsoft Store.
Step 1: Configuring the dump type
- Click on Start and look for Control Panel’.
- Double-click on System and select “Advanced system settings”.
- On the Advanced tab, click on Settings under Startup and Recovery.
- In the “Write debugging information” selection, select “Small memory dump”.
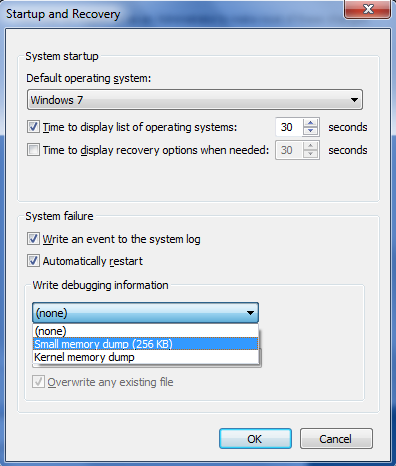
- To replace the small memory dump files’ folder location, enter a path in the box ‘Dump File’.
Step 2: Reading the dump type
- Go to the Microsoft Store on your Windows, type “windbg preview” in the search field, and select the exact result.
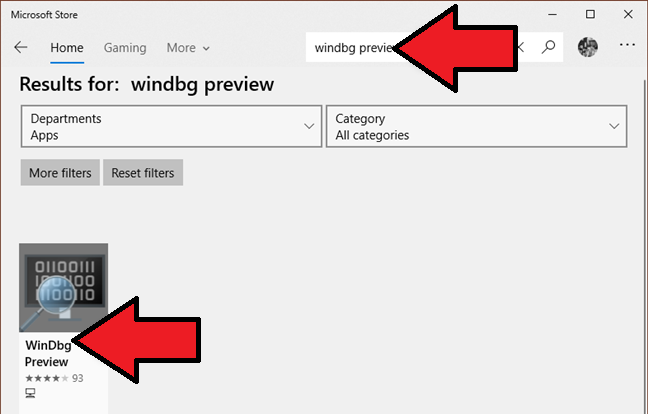
- On the WinDbg Preview page, click on Install.
- Wait for the app to be completely installed.
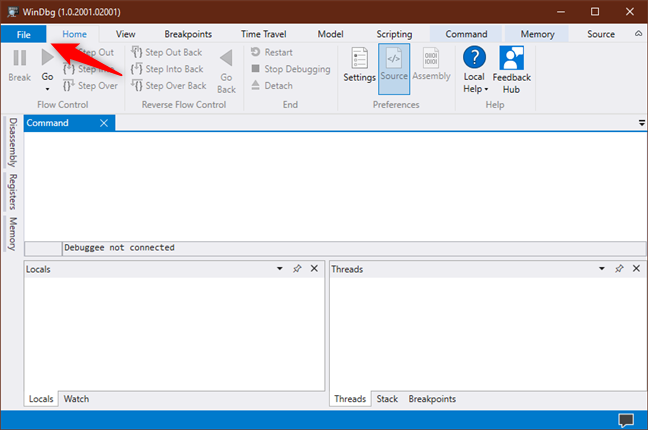
- After installation, open the WinDbg Preview app by right-clicking on the icon found in the Start menu and selecting “Run as an administrator”.
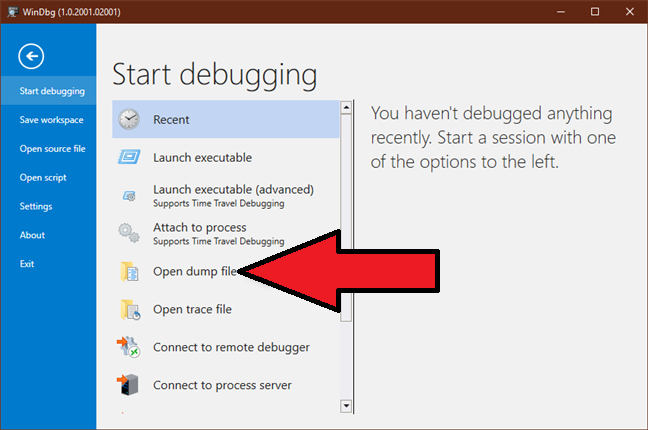
- To open a dump file, Click on File at the upper-left corner.
- Select “Open dump file” to choose the dump file to be analyzed. For the files generated after your Windows crashed, locate C:Windowsminidump.
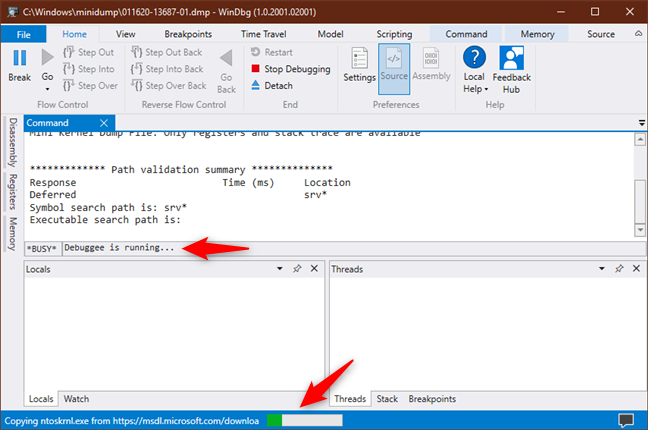
- Wait for things to be ready. You can see the BUSY message if it is still processing.
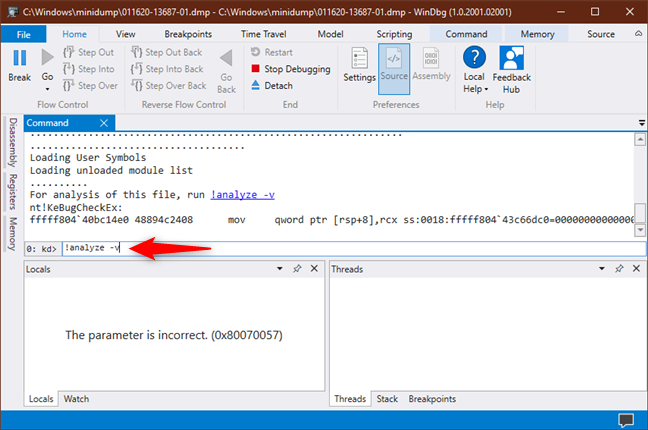
- After WinDbg Preview finished the preparation, it is time to analyze the file. Type in the text box beneath the Command panel the phrase ‘!analyze –v’ then hit Enter.
- The WinDbg Preview will start the analysis of the opened dump file. It may take a while depending on how large it is.
- After finishing the analysis, the results will then be displayed.
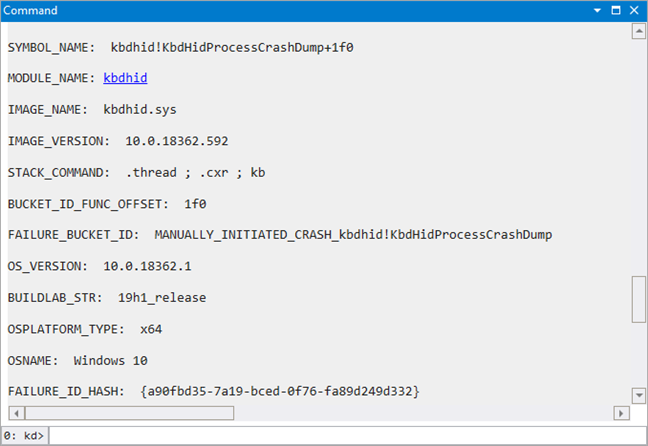
- Scroll down the Command panel and look for Bugcheck Analysis for the information.
- For the exact cause of the crash, look down further for BUGCHECK_CODE. Search Google for the interpretation of the code.
- Other information can also point out more details regarding the crash such as IMAGE_NAME, MODULE_NAME, and SYMBOL_NAME.
Summary: Read Windows Dump DMP Files in Windows 10 After a Crash
- First, run a full system scan to make sure that the issue is not caused by some malware.
- Next, copy the dump file to your desktop.
- Now, download and install Debugging Tools for Windows.
- Download Windbg Preview from the Microsoft Store.
- Launch WinDBG Preview app by clicking on its icon on your desktop. Click on "File" tab at the top left and select "Open Crash Dump".
- Now, select the dump file from your desktop and open it in WinDBG Preview app. You can see a detailed analysis of the dump file in the window of the app. See the attached screenshot.
Conclusion
Even though you are able to read the dump file, the information displayed may be too technical and will need more help to further interpret the details. The important thing is that the problem is being pointed out in the file and you can proceed to prevent the crash from happening again.
