How to create a dashboard in salesforce? We all know that Sitewide reports provides best options and tools for us, but if you don't have access to it or looking for report option that have multiple metrics, such as sales by country, sales by week with goals, dashboard can be helpful to get fast overview and snapshot of important data - Now this tutorial helps you add custom Salesforce dashboards in your salesforce instance.

Salesforce is CRM based business management site. Where you can easily create reports of your business. A dashboard is a place where you can present any reports graphically which is very easy to understand and make a presentation.
Stapes to Create a Dashboard:
- At first, open a browser on your computer.
- Now open a tab to continue the process.
- Click on the search bar and type the URL of Salesforce or copy and paste this link https://www.salesforce.com/in/?ir=1
- Login to your Salesforce account by giving your username and password.
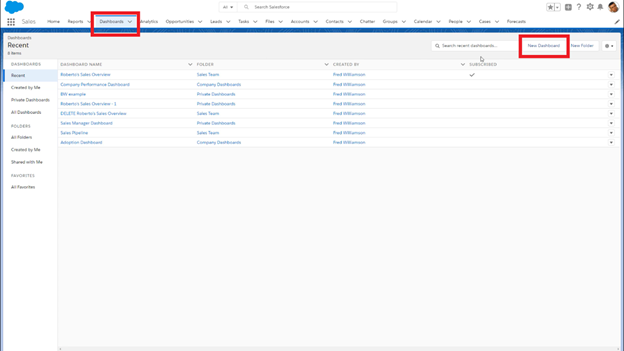
- After login, you will appear on the home page. Now click on Dashboard on the Menu Bar.
- At this time click on the ‘New Dashboard’ located in the top right corner of the dashboard page.
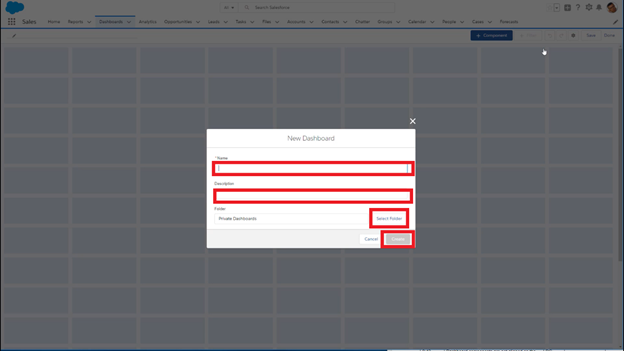
- Now Enter the dashboard name, description.
- Select the location to save the dashboard.
- Now click to continue the creation of a new dashboard.
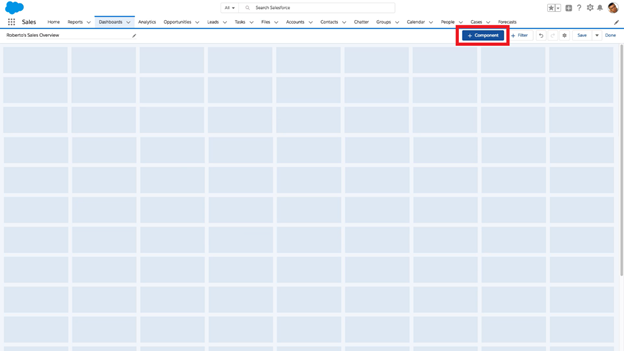
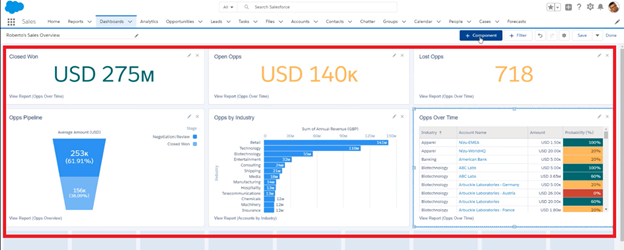
- An empty dashboard will appear now where the added item will be shown side by side.
- Now click on the ‘+ Component’ to add the slides in the empty dashboard.
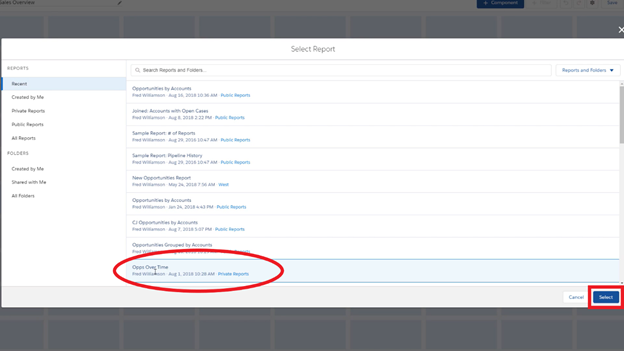
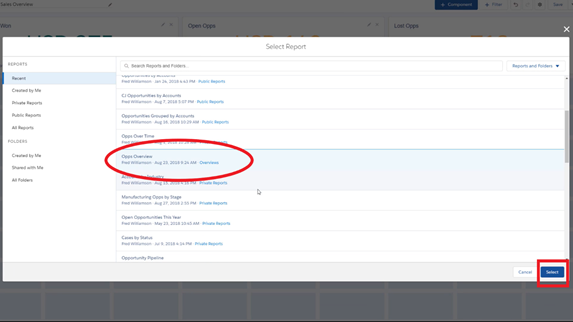
- Now a pop-up window will appear with your previous report. You have to select one report from the list to make a slide of a dashboard. If you don’t have any reports then first go and make a report.
- After selecting the report click the ‘Select’ button located on the bottom right corner of the windows.
- Now your final customization is open to make a design your wish.
- Select a layout from the display as an option.
- To show the total amount or average or other single-digit amount select the Metric Chart option.
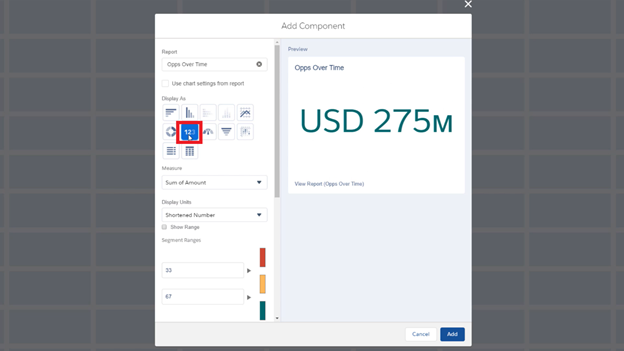 * From the measure option, you can choose which value from the report you want to display.
* You can also change the units by clicking on the display units.
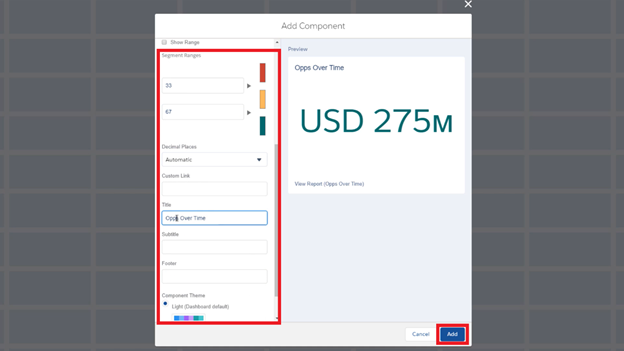
* From which range you want to show the value can be decided at ‘Segment Ranges’
* Component Theme is also available for this segment.
* Also ‘Decimal Place’ can be customized here. - Now click the “Add’ button to implement this Metric Chart in the dashboard.
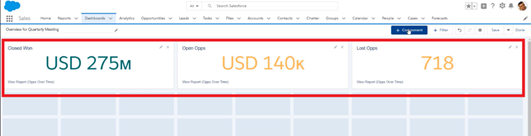
- Here are the three samples of the Metric Chart option.
- Now we will talk about Funnel Chart. Again, click on the additional component and select a report to customize it.
- Select the Funnel Chart option from the display as a menu.
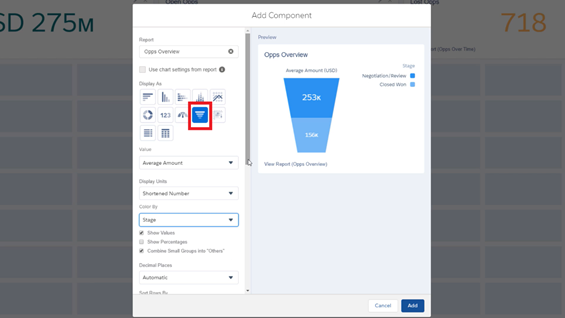 * Select your displayable value from the ‘Value’ option.
* Here you can compare multiple values by a different color on the color by’ potion.
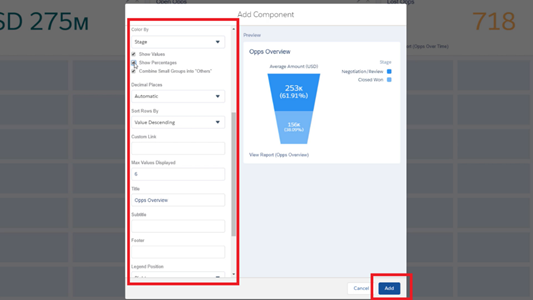
* The number of stages to display can be customized on ‘Max value displayed’
* Row sorting is also available here. - Now click the add button to finalized this chart.
- To show more information in a compact area table is the best option. To select the table click on the table option from the ‘display as’ corner.
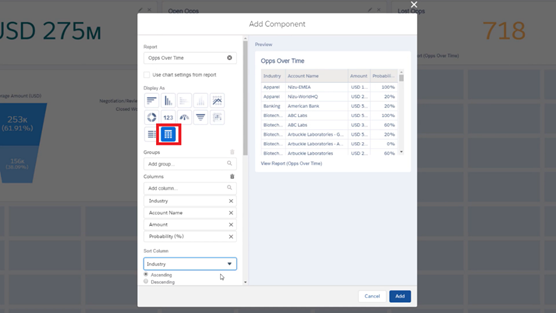 * Displaying information n group is easier’
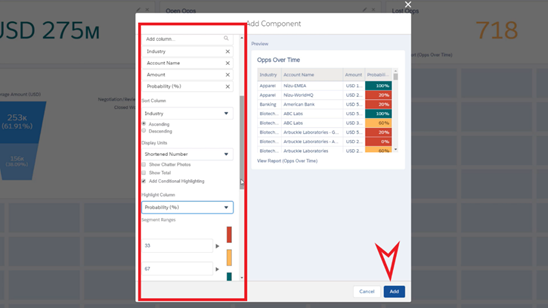
* Add your column by need also delete as wish.
* Sorting is very helpful for its various option.
* Highlight any category by display units.
* Segment range helps to understand the value well. - After all Setting click on ‘Add’ to display the table to the dashboard.
- You can also add other chats and graphs as you need. With a few component dashboards looks like a smart solution for information.
- You can also increase the area of a component by click & drag on their border. Also, can move them by click & drag on the middle of them.
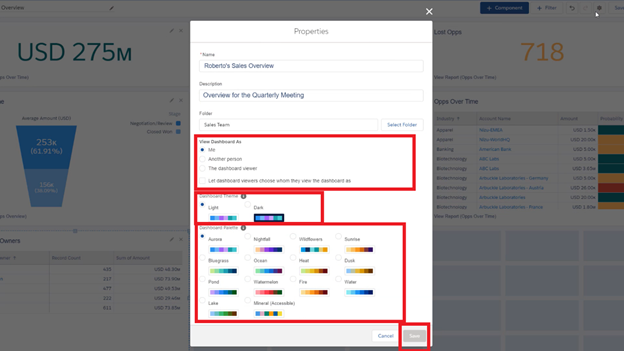
- Viewing access and the whole theme can be changed in the settings located on the top right corner.
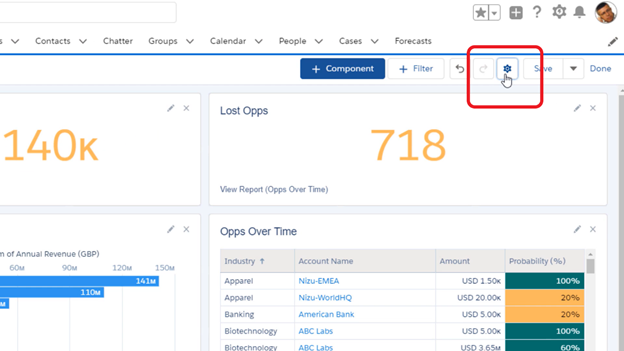
- Select those option and click ‘save’
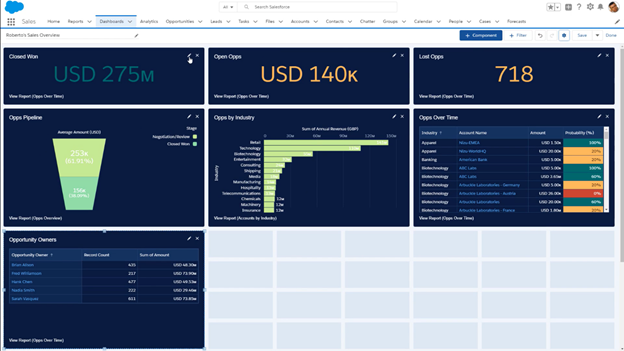
- The final look is ready. With this, you have created a Dashboard on Salesforce.
Summary: Create a dashboard in salesforce
- Click create in the navigation bar.
- Click New Dashboard
- Enter Dashboard Settings
- Add Components.
- Click Save.
- Click Run Now to refresh your report.
